The bell curve is one of the most recognized and widely used concepts in statistics. It represents a normal distribution, where data points are symmetrically distributed around the mean. The shape of the curve resembles a bell, with the majority of the data clustering around the center and fewer data points toward the extremes. This statistical model plays a crucial role in various fields, including performance appraisal in the corporate world.
What is Bell Curve ?
The bell curve, also known as a normal distribution, is the spread of data points in a symmetrical pattern where most values are concentrated around the mean in a graph. The curve is called “bell-shaped” because it resembles the shape of a bell. The bell curve meaning is used in various different fields.
Bell Curve Formula
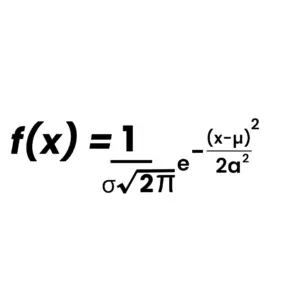
Here:
- f(x) is the value of the probability density function at a particular point x.
- μ (mu) is the mean (average) of the distribution, which is the center of the bell curve.
- σ (sigma) is the standard deviation, which controls the width of the curve. A smaller σ means the curve is narrower, and a larger σ means the curve is wider.
- e is Euler’s number, approximately 2.71828 (the base of the natural logarithm).
- π is the constant pi, approximately 3.14159.
- x is a point on the horizontal axis (where the value of the curve is being calculated).
The curve is defined by two key parameters:
- Mean (μ): The average value of the data, located at the center of the bell curve.
- Standard Deviation (σ): A measure of how spread out the values are from the mean. A larger bell curve standard deviation results in a wider curve, indicating more variability in the data, while a smaller bell curve standard deviation produces a steeper, narrower curve.
Key Characteristic of Bell Curve
- Symmetry: The bell curve is symmetrical, meaning the data is evenly distributed on either side of the mean.
- Peak at the Mean: The highest point of the curve is at the mean, indicating that most values lie close to the center.
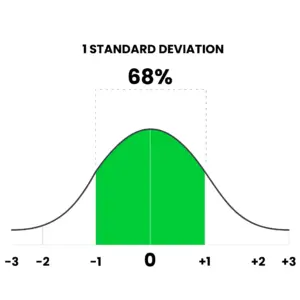
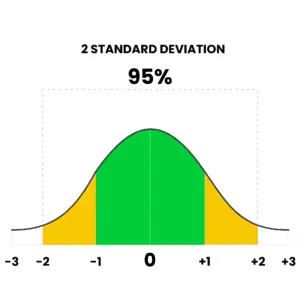
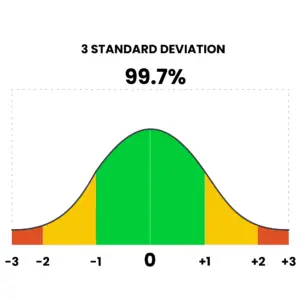
- 68-95-99.7 Rule: In a normal distribution:
- 68% of the data points fall within one standard deviation of the mean.
2. 95% fall within two standard deviations.
3. 99.7% fall within three standard deviations.
Applications of Bell Curve
The curve distribution is used in various areas such as:
- Education: To analyze student performance, grade distributions, and test scores.
- Healthcare: For analyzing the distribution of health data and understanding population health metrics.
- Business & HR: To evaluate employee performance, compensation plans, and market behavior.
- Finance: In risk analysis and predicting stock market behavior.
The Bell Curve in Performance Appraisal
In the corporate world, bell curve in performance appraisal is a widely adopted method to evaluate and categorize employee performance. This system classifies employees into different performance categories based on the curve distribution, which helps businesses assess and reward performance effectively. Here’s a closer look at how the appraisal it works and its various aspects in HR appraisal:
The Basics of the Bell Curve in Performance Appraisal
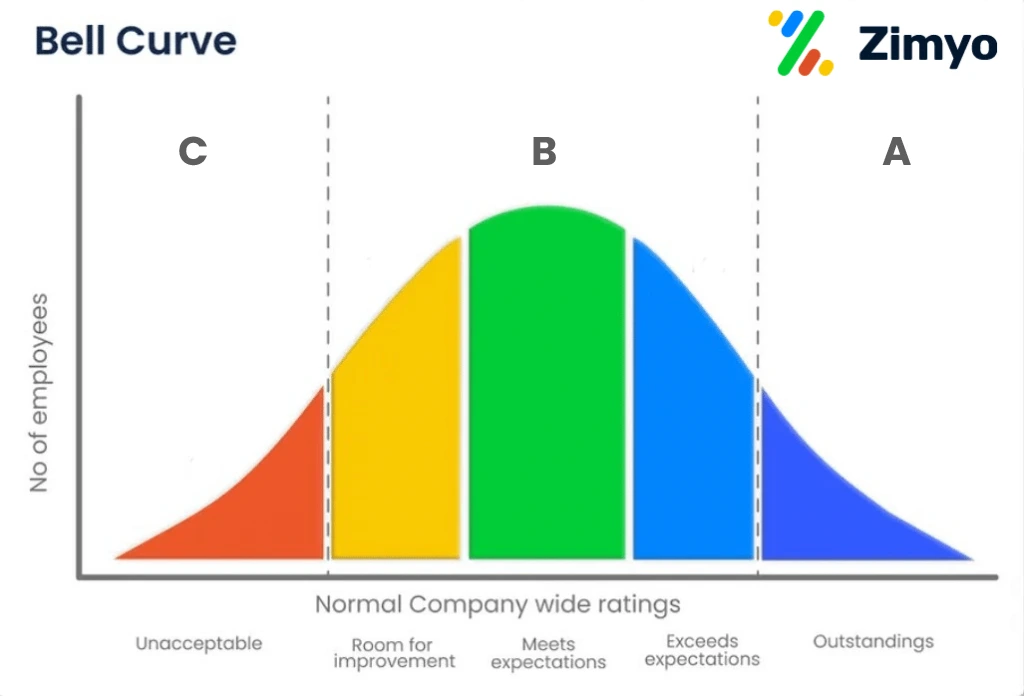
In a typical bell curve HR appraisal system, employee performance is ranked across a range of categories, typically divided into three main groups:
- Top Performers (A): These are the employees who perform at the highest level. They fall into the top 20% of the distribution and are often rewarded with promotions, bonuses, or other incentives.
- Average Performers (B): Most employees (usually around 70%) fall into this category. These employees meet expectations and perform well but may not exhibit exceptional achievements.
- Low Performers (C): Employees in the bottom 10-20% are considered low performers. They may require development plans, coaching, or even disciplinary actions


Advantages and challenges of the Bell Curve in Performance Appraisal
No performance appraisal method is perfect. The Bell Curve has its own strengths and weaknesses. Let’s explore both.
Advantages
- Standardization: The bell curve in appraisals helps standardize evaluations across different departments or teams, making it easier to compare performance fairly.
- Easy Identification of Top Performers: The Bell Curve makes it easy for managers to identify high performers, helping with reward and retention strategies. For instance, employees in the top 20% can be fast-tracked for promotions.
- Objectivity: It reduces subjectivity in performance ratings and ensures that performance is measured against clear metrics.
- Balances Manager Bias: If a manager is too strict or too lenient, the Bell Curve forces a balanced evaluation. This keeps performance reviews fairer across the board.
- Resource Allocation: By categorizing employees into different performance tiers, HR can better allocate resources. For example, on the job training programs can be tailored for low performers, while development plans can be created for future leaders.
Criticisms and Challenges
While the bell curve distribution is widely used, it does have its fair share of criticisms and challenges:
- Forced Ranking: One of the biggest drawbacks of using this curve in performance appraisal is that it forces managers to rank employees even if the performance distribution doesn’t fit the curve. This can result in unfair ratings and may demotivate employees.
- Discrepancy in Team Performance: In teams that perform exceptionally well as a whole, applying the bell curve can be problematic, as even great employees may fall into the “average” or “low performer” category.
- Lack of Flexibility: The rigid structure of the bell curve system may not reflect the true performance of employees, especially in roles where performance isn’t easily quantifiable.
- Rigid System: Sometimes, the system’s rigidity means high performers don’t get the recognition they deserve, simply because there are too many high performers for the curve.
- Loss of Morale: Employees placed in the lower categories may feel demotivated, even if they are good performers. This can increase turnover costs.
- Not Ideal for Small Companies: If your company has fewer than 300 employees, the Bell Curve might not be suitable, as small data sets make it harder to distribute performance accurately.
Real-World Examples
Some large organizations like Infosys, Wipro, and ICICI Bank still use the Bell Curve to assess thousands of employees. These companies rely on it to differentiate top performers and streamline reward systems. But others, like Google and Microsoft, have abandoned it, favoring more flexible performance management systems. Why? They believe that employees should not be forced into strict categories but instead evaluated on their individual merits.
I was able to implement the platform on my own. It helps in assigning the tasks to other employees, conducting surveys and polls, and much more. The ease of use and self-onboarding is something that I would like to appreciate.
Sonali, Kommunicate
Zimyo simplifies attendance management for our organization. The leave and attendance are so streamlined that we have never faced any difficulties with the system.
Anurag, Eggoz Nutrition
Does the Bell Curve Always Work?
Now, let’s ask the hard question: Does this method always work? Not always. While it offers a structured system, it can also be rigid. Here’s why.
Assumptions and Restrictions
- Rigid Pattern: The curve assumes that only a few employees will be high performers, while most will be average. But what happens if your team has higher performers than the curve allows? Managers may have to rank someone lower than they deserve, just to fit the curve.
- Restricted Ranking: Only 10% can be labeled as low performers, even if there are fewer than that. This can create unfair pressure on managers and employees.
Alternatives and Evolving Trends
To address some of the criticisms, companies are increasingly moving towards more flexible performance evaluation methods. Some of these alternatives include:
- Continuous Feedback Systems: Providing employees with ongoing feedback rather than annual performance appraisals.
- 360-Degree Feedback: Gathering input from peers, subordinates, and managers to get a more holistic view of employee performance.
- Employee Development Focus: Shifting the focus from ranking employees to identifying growth opportunities and providing training and support.
The bell curve is a powerful tool in statistics that finds significant applications in various fields, including performance appraisal in the corporate world. When used correctly, the bell curve in performance appraisal allows businesses to identify top performers, maintain a balanced distribution of performance, and ensure fair evaluations. However, it’s important to be mindful of its limitations and the potential for misapplication in certain organizational contexts. By understanding both the strengths and weaknesses of the appraisal bell curve, companies can refine their performance management systems to foster a more supportive and growth-oriented work environment.
Whether you’re navigating HR appraisals or simply looking to understand the bell curve meaning in your workplace, recognizing its role in performance evaluations is key to creating a fair and motivating environment for all employees.
FAQs (Frequently Asked Questions)
Bell curve is the visual representation of the performance of employees.
The 5 point rating scale refers to the rating of the population. It means not more than 10% of employees must be rated as 5.
Bell curves are useful in visualizing the mean, median and mode of the given data.